4 min read
El Niño Is UnderwayImage of the Day for June 18, 2026Satellite observations of sea surface height indicated that the 2026 event continued to strengthen in early June.
NASA Earth Observatory
Jun 18, 2026 ArticleEl Niño, characterized by warmer-than-normal water temperatures in parts of the equatorial Pacific, made its return in June 2026. Observations of sea surface height from the Sentinel-6 Michael Freilich satellite that month indicated that the 2026 event was continuing to strengthen.
The natural, recurring phenomenon can have widespread effects, typically bringing wetter conditions to the U.S. Southwest and drought to countries in the western Pacific, such as Indonesia and Australia. NOAA declared an El Niño on June 11, after sea surface temperatures in the central and eastern equatorial Pacific measured at least 0.5 degrees Celsius above average for several consecutive months.
Meanwhile, NASA scientists have been observing a complementary sign of El Niño: areas of elevated sea surface height. When ocean water warms, it expands in volume and causes the sea surface to rise—making the water’s height a reliable indicator of ocean temperatures. Warmer-than-normal temperatures, hence higher sea surface heights, in parts of the equatorial Pacific Ocean are associated with El Niño.
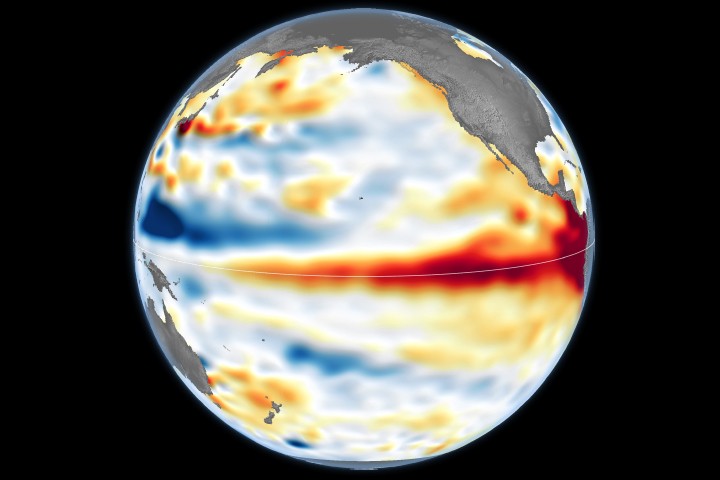
The map above depicts sea surface height anomalies across the central and eastern Pacific Ocean as observed on June 8, 2026. Shades of red indicate sea levels that were higher than average. Normal sea level conditions appear white, and lower areas are blue.
Data for the map were acquired by the Sentinel-6 Michael Freilich satellite—launched in 2020 by NASA and led by ESA (European Space Agency)—and processed by scientists at NASA’s Jet Propulsion Laboratory (JPL). Note that signals related to seasonal cycles and long-term trends have been removed to highlight sea level anomalies associated with El Niño and other short-term natural phenomena.
Earlier in spring 2026, the satellite started to detect precursor signs of El Niño as swells of warm water hundreds of miles wide, known as Kelvin waves, moved from the western Pacific to the eastern Pacific. That happens when trade winds in the western equatorial Pacific weaken and then temporarily reverse to blow from the west. Warm water piles up in the east, deepening the warm surface layer, lowering the thermocline, and suppressing the upwelling that usually keeps waters along the Pacific coasts of the Americas cooler.
This buildup of heat beneath the water’s surface is what sea surface height observations capture. It goes beyond surface temperature measurements to indicate how much heat is stored in the subsurface. That’s important because a shallow warm layer might not have much impact on climate and weather, while a large reservoir of heat below the surface can matter more.
According to JPL sea level researcher Severine Fournier, deputy project scientist for Sentinel-6 Michael Freilich, conditions in the western Pacific on June 8 looked similar to those from the same time in 1997, a year when an exceptionally strong El Niño emerged. Warm conditions in the eastern Pacific in 2026 have lagged behind, however, with fewer Kelvin waves built up by the same date.
Still, more warm Kelvin waves appeared to be approaching the eastern Pacific, meaning El Niño was still strengthening. Whether it catches up to 1997 depends on ocean activity in the coming weeks. “For now, it looks like it’s going to be a big one—more so than I would have said last week—but we still need more observations to know what’s going to happen.”
NASA Earth Observatory image by Lauren Dauphin, using modified Copernicus Sentinel data (2023) processed by the European Space Agency and further processed by Josh Willis, Severin Fournier, and Kevin Marlis/NASA/JPL-Caltech. Story by Kathryn Hansen.
Downloads
June 8, 2026
JPEG (1.19 MB)
References & Resources
- Climate Prediction Center/NCEP/NWS (2026, June 11) El Niño/Southern Oscillation (ENSO) Diagnostic Discussion. Accessed June 17, 2026.
- NASA Earth Observatory (2025, September 25) El Niño. Accessed June 17, 2026.
- NASA Earth Observatory (2023, June 21) El Niño Returns. Accessed June 17, 2026.
- NASA’s Jet Propulsion Laboratory (2026, May 27) NASA-European Sea Level Mission Homes in on El Niño. Accessed June 17, 2026.
- NOAA (2026, June 11) El Nino forms, expected to strengthen, say NOAA forecasters. Accessed June 17, 2026.
You may also be interested in:
Stay up-to-date with the latest content from NASA as we explore the universe and discover more about our home planet.
Barents Sea Tied to Low Arctic Sea Ice 4 min readPatches of open water in the region contributed to low sea ice extent across the Arctic in March 2026, which…
Article New Eruption in the Bismarck Sea 5 min readSatellite imagery shows a surge of new volcanic activity in the ocean near Papua New Guinea.
Article Color Off the Mid-Atlantic Coast 4 min readSomething is brewing in shallow waters offshore of Delaware, New Jersey, Maryland, and Virginia.
Article Keep ExploringDiscover More from NASA Earth Science
Subscribe to Earth Observatory Newsletters
Subscribe to the Earth Observatory and get the Earth in your inbox.
Earth Observatory Image of the Day
NASA's Earth Observatory brings you the Earth, every day, with in-depth stories and stunning imagery.
Explore Earth Science
Earth Science Data
Open access to NASA’s archive of Earth science data