4 min read
NASA Uses Machine Learning to Enhance Flash Flood WarningsNASA Science Editorial Team
Jun 16, 2026 ArticleThe Transient Artifact and Continuous Learning System (TACLS) leverages data from continuously operating satellite networks coupled with machine learning models to help meteorologists at the National Weather Service forecast flash floods more efficiently. This new software is the result of a collaboration between NASA’s Jet Propulsion Laboratory, the University of California, San Diego (UCSD), and the National Oceanic and Atmospheric Administration (NOAA) National Weather Service (NWS).
Show downloadsTACLS test prediction runCloseTo view this video please enable JavaScript, and consider upgrading to a web browser that supports HTML5 video
A visual analysis from a TACLS test prediction run using data from flash floods the week of Christmas, 2025. The image shows flash flood warning (FFW) probabilities generated by TACLS (in shades of red) and overlaid on areas that received flash flood warnings from the National Weather Service (in blue).Credit: UCSD Scripps Institution of OceanographyCreated with support from NASA’s Earth Science Technology Office (ESTO), TACLS leverages machine learning to automatically locate evidence (unusual increases in atmospheric moisture) of impending flash flooding that meteorologists may otherwise miss as they analyze large amounts of data. TACLS flags that evidence, indicates where flash flooding could likely occur, and displays that information via a user-friendly visualization for human analysts to interpret. Those analysts can then decide whether to issue a flash flood warning or weather advisory.
This novel framework for tracking extreme weather events and predicting imminent flash floods operates in near real-time, producing forecasts in as little as fifteen minutes.
“That’s really what we wanted to do, to give meteorologists a tool to help decision making for flash flood warnings,” said Yehuda Bock, Distinguished Researcher at the UCSD Scripps Institution of Oceanography and principal investigator for TACLS.
In simulations testing, TACLS used data from diverse severe weather events—including atmospheric rivers, monsoonal convection, and tropical cyclone remnants—between 2017 and 2023 and successfully captured 93% of the issued flash-flood warnings. Meteorologists from the National Weather Service are currently working to incorporate TACLS into their existing systems for forecasting flash floods in Southern California.
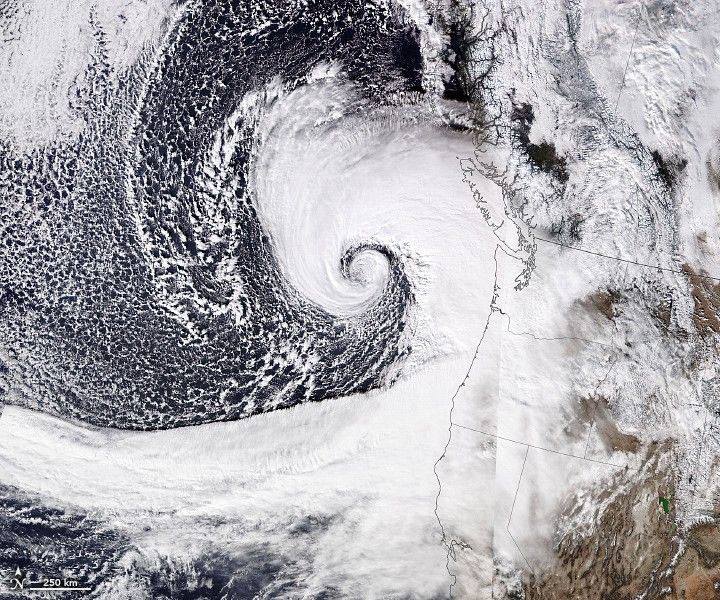
A cyclone makes landfall across the California coast on November 19, 2024. TACLS will help give communities more time to prepare for impending severe weather.Credit: NASAThis learning system has two main components. First, an analytic back-end software suite uses machine learning algorithms to process satellite data and determine areas at risk for flooding. Second, user-friendly visualization software highlights those areas for further analysis by humans.
The ACLS back-end software analyzes data from satellites in the Global Navigation Satellite System (GNSS), a constellation of satellite networks that drive navigation services around the world. Water vapor in the troposphere delays signals from these satellites as they travel to Earth. This signal delay can be analyzed to calculate the amount of water vapor in the atmosphere over a particular location on Earth.
The TACLS analytic back-end software suite features a machine learning model trained using more than 30 years of past GNSS data. This model is an anomaly detector that tracks unusual increases in atmospheric moisture. The model then carefully examines that atmospheric moisture data and determines whether it’s either an artifact (a false feature or distortion in the data) or a transient (a time-sensitive physical event, like heavy precipitation) that requires interpretation by human analysts.
If TACLS determines the data represents a transient, such as an extreme weather event that warrants a flash flood warning, it will forward that data to the TACLS visualization software (MGViz) for further evaluation by humans. The analysts use their judgement and experience to interpret these events and determine whether the flagged data indicates a flash flood is likely, and, if necessary, issue a flash flood warning.
Several past innovations developed at JPL are leveraged by TACLS to process GNSS data and present the results. The analytic back-end software suite incorporates elements from JPL’s Domain-agnostic Outlier Ranking Algorithms program and the Time-series Forecasting, Evaluation, and Deployment program. The TACLS visualizer is based on the Multi-Mission Geographic Information System, originally developed at JPL for NASA’s Mars missions.
The TACLS software binds all these components within a novel system that enhances existing methods to reduce the amount of time it takes for a human analyst to determine whether to issue a flash flood warning.
Both the TACLS software and the data used to train it will be open-source, allowing scientists to either tailor this model in response to their unique research needs or create their own model from scratch.
For additional details, see the entry for this project on NASA TechPort.
Project Lead: Dr. Yehuda Bock, University of California, San Diego.
Sponsoring Organization(s): NASA’s Earth Science Technology Office Advanced Information Systems Technology Program; JPL; NOAA; National Weather Service.