3 min read
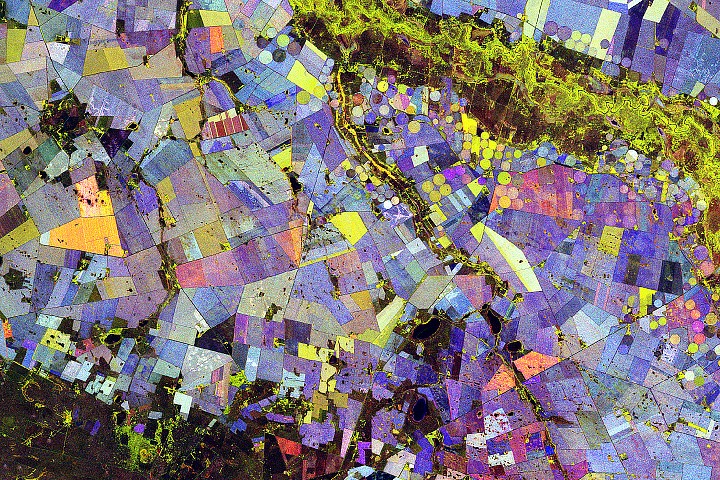
Painting the Growing Season in the Maize TriangleImage of the Day for May 29, 2026Radar data from an agricultural area in South Africa, shown in a vivid color palette, reveal crop types and how they changed during the Southern Hemisphere's growing season.
NASA Earth Observatory
May 29, 2026 ArticleAlong the Vetrivier (Vet River) in South Africa, a patchwork of circular and rectangular fields spreads across what is otherwise a semi-arid part of the Free State province. The water brings life to an array of crops, contributing to the agricultural productivity of the wider Maize Triangle.
The agricultural area shown in this image lies about 110 kilometers (70 miles) north of Bloemfontein. The scene is reminiscent of a modern abstract painting. Colorful circles mingle with straight-edged fields in combinations of red, green, and blue. But each color carries physical meaning, providing clues about crop types and revealing how they changed over the course of the Southern Hemisphere’s growing season.
Data for the visualization were acquired by the NISAR (NASA-ISRO Synthetic Aperture Radar) satellite during 10 passes over the area between November 2025 and March 2026. L-band radar observations, which can “see” vegetation’s structure instead of its color, were analyzed to produce per-pixel statistical measures across the scene. By combining radar scattering behaviors observed across multiple dates into a single composite, scientists built a compact summary of seasonal agricultural activity and change.
“It’s a pretty picture, but there are also important things that it communicates to us,” said Paul Siqueira, a scientist at the University of Massachusetts Amherst, and ecosystems lead of the NISAR science team. “With NISAR, crops like maize and sunflower appear differently than forests because of their size differences and period of growth.”
In this false-color composite, green indicates a vegetated area; red represents an unvegetated surface; and blue indicates how rapidly a vegetated area changed over the season. For instance, stable vegetation—such as forested areas—display a light blue component. Plants that change structure throughout the season, such as wheat and maize (corn), have a darker blue component.
In practice, most pixels contain a mix of these colors, producing the visualization's rich and varied palette. For example, plants that grow rapidly (contributing some green) and are harvested early (contributing a large red component) make fields appear orange. Sunflowers are known to exhibit this pattern in the region, though ground validation would be needed to confirm their presence in any given field.
The processing behind the visualization is relatively straightforward, but it is based on a large amount of data. NISAR sends radar signals to Earth and measures how they bounce back; the orientation of the returned radar waves (cross-polarized or co-polarized) carries information about the structure of vegetation and surfaces. By combining radar measurements from multiple satellite passes and calculating statistics for each pixel, scientists built the detailed map of the landscape’s characteristics throughout the growing season.
The technique provides a repeatable way to monitor crop development, the impacts of irrigation, and land-use change across large regions. As NISAR collects more data, researchers will be able to compare seasons, track field-to-field differences in growth patterns, and better understand how agricultural systems respond to water availability and climate variability.
Image by Paul Siqueira (UMass Amherst) of the NISAR science team using data from the NISAR GCOV product, and prepared for NASA Earth Observatory by Michala Garrison. Story by Kathryn Hansen.
Downloads
November 22, 2025 - March 10, 2026 composite
JPEG (23.76 MB)
References & Resources
- NASA (2025, July 25) Get to Know SAR - Overview. Accessed May 28, 2026.
- NASA (2026, April 14) NISAR. Accessed May 28, 2026.
- NASA (2026, April 14) NISAR Handbook. Accessed May 28, 2026.
- NASA (2025, July 23) Polarimetry. Accessed May 28, 2026.
You may also be interested in:
Stay up-to-date with the latest content from NASA as we explore the universe and discover more about our home planet.
Seasons Change in Southwest Virginia 3 min readFrom autumn color to a winter-white finish, forested areas around Blacksburg trade foliage for snow over the span of two…
Article Faster Detection of Forest Loss 7 min readScientists pioneered a new system that combines data from multiple Earth-observing satellites to identify forest clearing up to 100 days…
Article Eyeing the Richat Structure 3 min readThe circular geologic feature in northwestern Africa can be hard to recognize from the ground, but it is obvious when…
Article Keep ExploringDiscover More from NASA Earth Science
Subscribe to Earth Observatory Newsletters
Subscribe to the Earth Observatory and get the Earth in your inbox.
Earth Observatory Image of the Day
NASA's Earth Observatory brings you the Earth, every day, with in-depth stories and stunning imagery.
Explore Earth Science
Earth Science Data
Open access to NASA’s archive of Earth science data