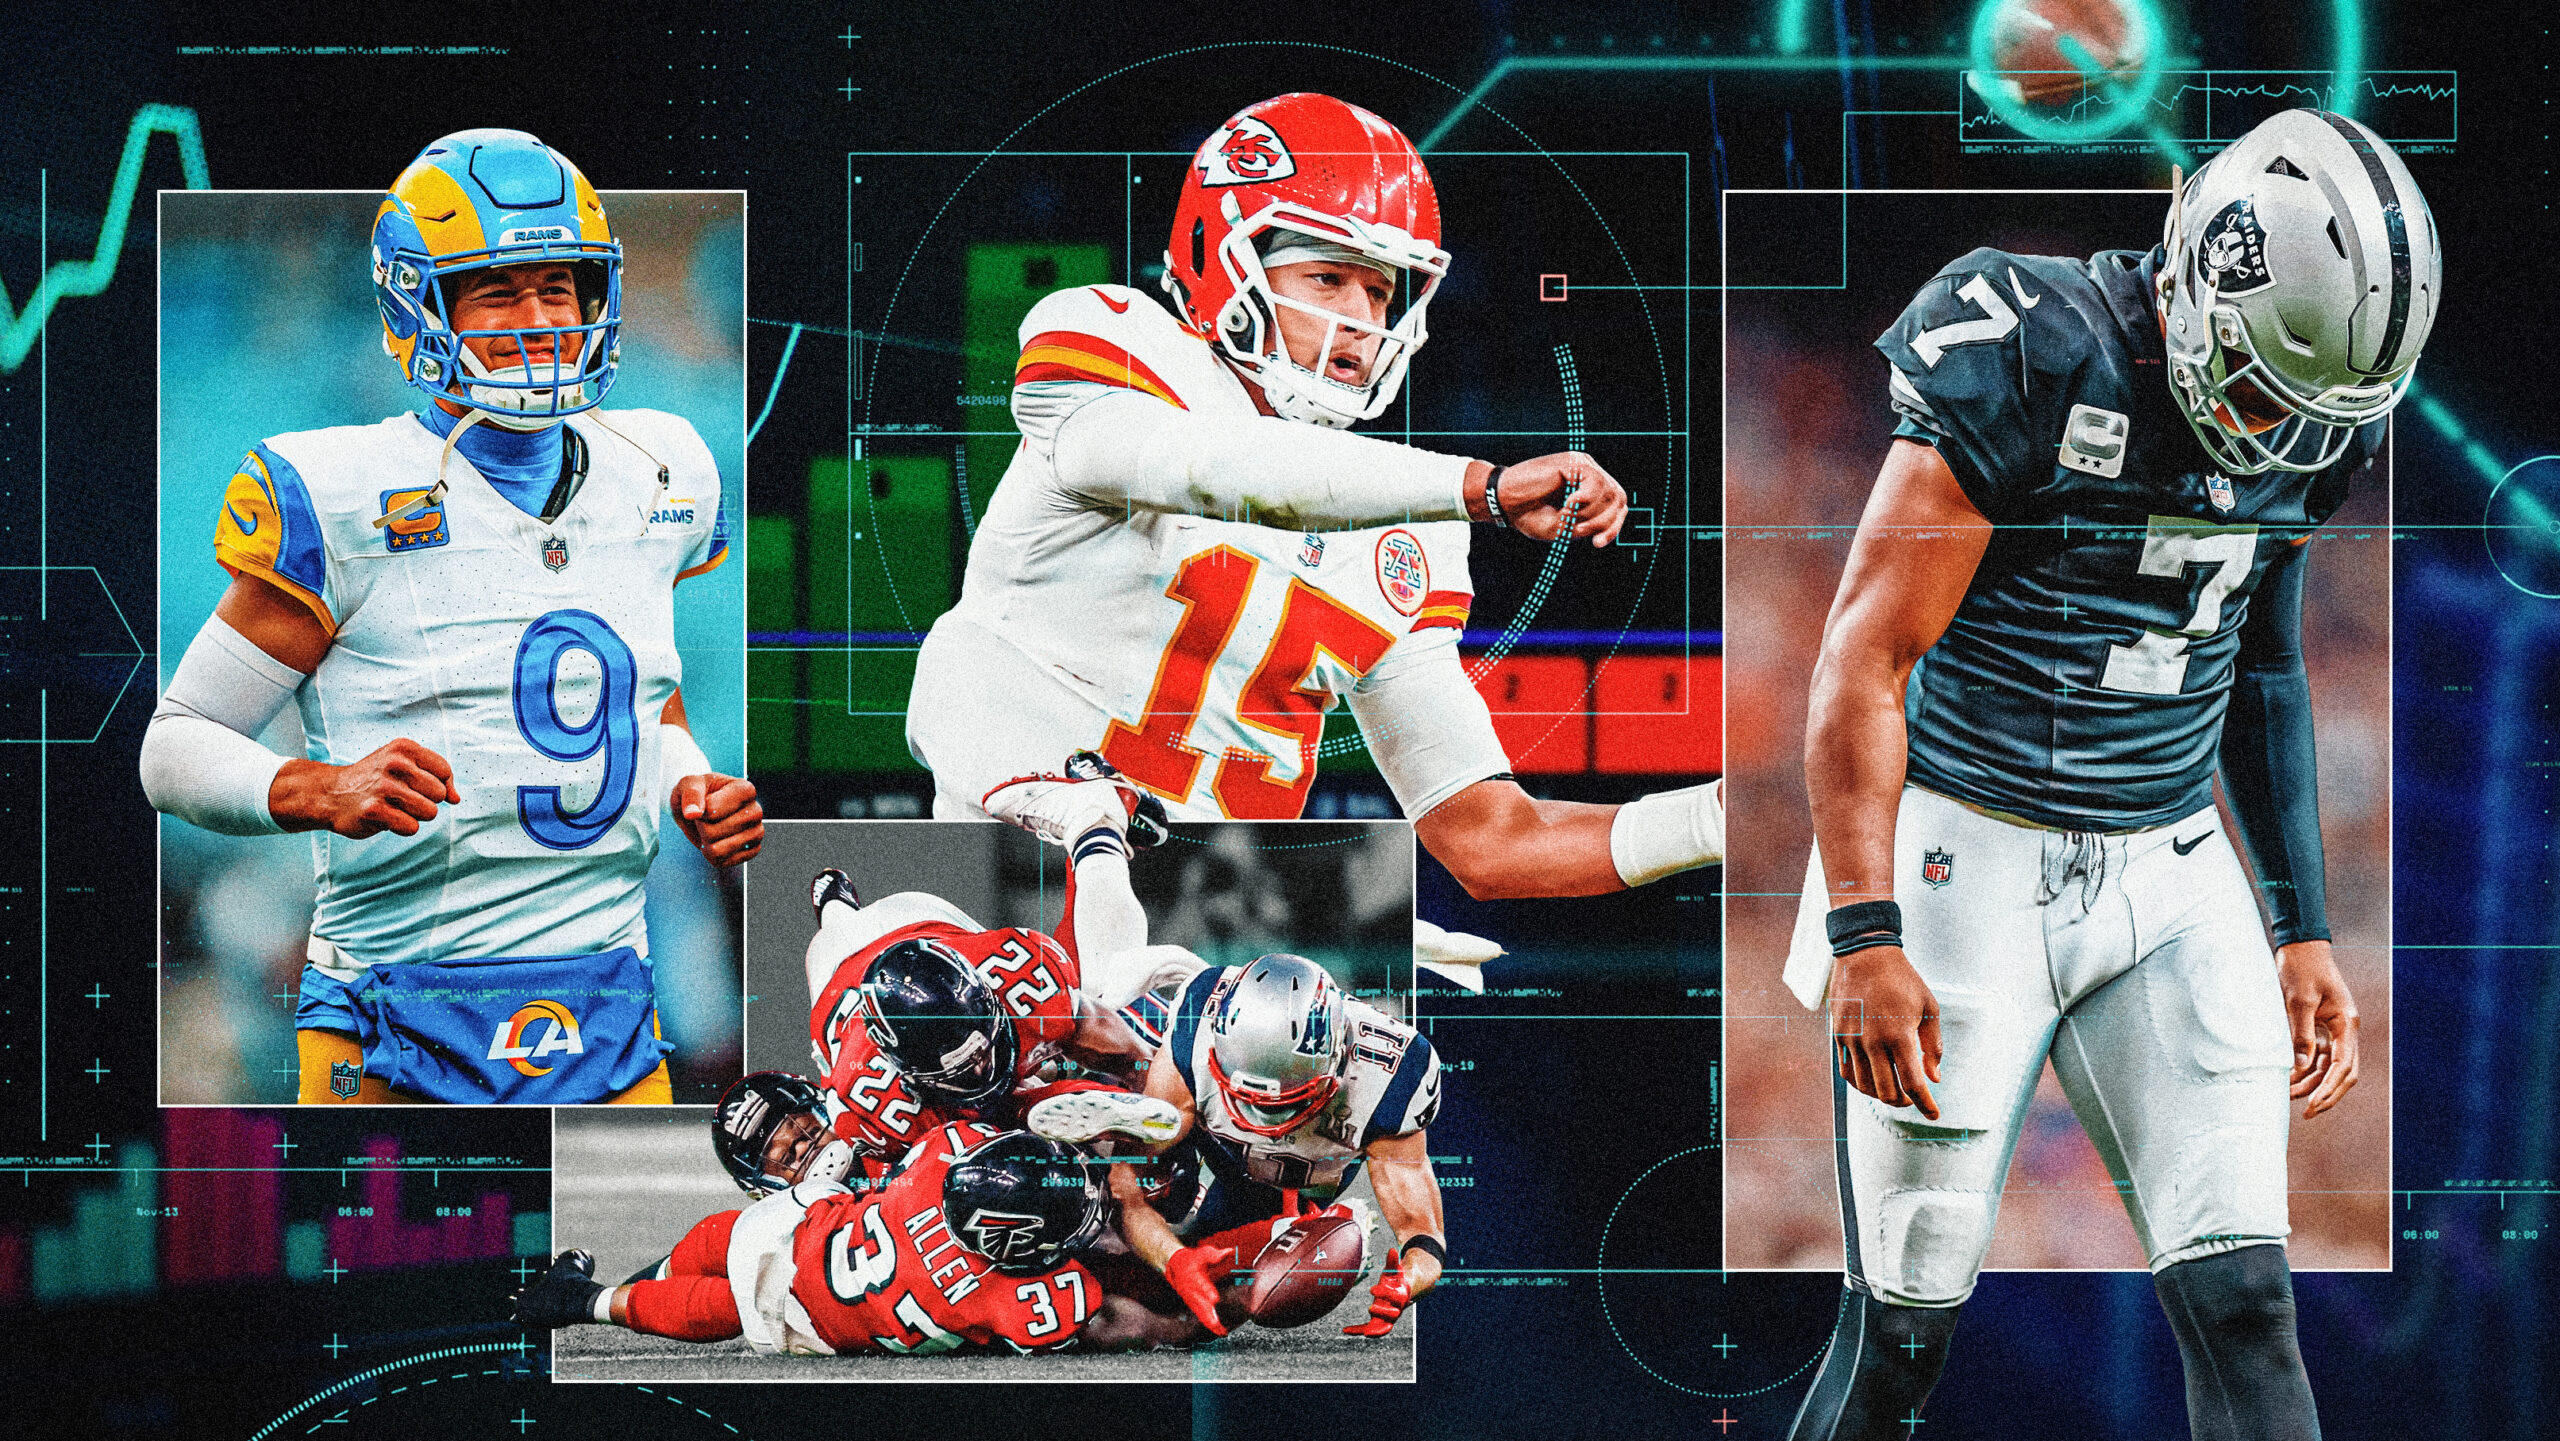
Two minutes and 28 seconds left in Super Bowl 51. The score is 28-20, Atlanta. New England has the ball and a chance to complete what would be the greatest comeback in Super Bowl history. Tom Brady fires across the middle into traffic. Falcons cornerback Robert Alford gets two hands on it, but the ball pops loose. It ricochets between four sets of hands and hangs in the air for an eternity before wide receiver Julian Edelman somehow claws it in for a catch just inches from the turf. Four plays later, the New England Patriots score, and they go on to win in overtime.
That catch remains one of the most unforgettable plays in Super Bowl history, and deservedly so. The sheer skill Edelman displayed to corral the ball inches above the turf made it a moment worthy of every word it occupies in the NFL history books. From a pure playmaking standpoint, it stands among the greatest plays the Super Bowl has ever produced.
But if you strip away the spectacle and evaluate the play through a colder, more critical lens, there’s another reality underneath it all: the play only exists because a defender failed to finish an interception.
This is one of the most under-discussed truths in football: the biggest moments in the sport sometimes just come down to luck. Since 2006, PFF has charted 103 instances in which a defender dropped a would-be interception before the quarterback produced a big-time throw or touchdown on the very next snap. Edelman’s catch is one of the most famous examples — and it’s worth wondering how differently NFL history might look if Alford had managed to hang on to that football under those brightest of lights.
A Decade of Charting
The interception column, broken down.
2016-25 0.00% Of turnover-worthy throws were intercepted 0.00% Of attempts were graded asturnover-worthy 0.00% Of receiver drops resulted in interceptions 0.00% of non-turnover-worthy throws became interceptions The numbers below are pulled from every charted pass in the window. Keep reading.
A look at luck: The framework
With that in mind, we took a deeper look at the stat that tends to draw the most attention in quarterback evaluation — interceptions — and asked a more difficult question: How "right" is that number? How much of it is truly on the quarterback? How much comes down to good luck, and conversely, how much of it is simply bad luck?
The truth behind interception totals
The first major step toward answering that question came with the creation of PFF’s turnover-worthy play metric. A turnover-worthy play is charged whenever a quarterback puts the ball directly in harm’s way with a throw that should reasonably result in a turnover — a bad read into coverage, a late throw over the middle, an underthrown deep shot or any pass that earns a play-level grade of -1 or worse. You can learn more about how these passes are graded by reading this article.
In many ways, turnover-worthy plays changed how quarterbacks are evaluated. Interceptions alone only tell you which risky throws happened to end in turnovers. Turnover-worthy plays tell you how often the quarterback actually made a bad decision or throw in the first place.
But when you combine those two metrics — interception totals and turnover-worthy plays — with the rest of the play-by-play data PFF collects on every passing snap, the interception column begins to tell a far more nuanced story. The raw total no longer reflects only quarterback play, but also the randomness layered on top of it.
Suddenly, entirely different questions emerge. How lucky was a quarterback to throw only five interceptions over an entire season? How unlucky was another who finished with 17? Which quarterbacks consistently put the ball in harm’s way but escaped punishment, and which saw otherwise-stable throws repeatedly turn into turnovers because of factors outside their control?
Editor's note: Naturally, quarterbacks can generate turnover-worthy plays in a number of ways beyond aimed passes — fumbles in the pocket, botched handoffs, strips as runners or scramblers, or even mishandled snaps and failed throwing motions. For the purposes of this analysis, however, we are isolating only aimed passes that were charted as turnover-worthy throws. Fumbles and all other non-passing turnover-worthy plays have been removed from the dataset.Plays nullified by penalty have also been excluded.
Quantifying interception luck
From 2016 to 2025, just 49.09% of turnover-worthy throws resulted in actual interceptions. The rest were dropped by defenders, otherwise broken up or simply fell harmlessly incomplete. An interceptable throw, but a zero in the interception column. That's good luck.
The reverse is just as common. Across that same 10-year sample, there have been 1,441 interceptions thrown on passes that were not deemed turnover-worthy. That's one in three of all interceptions thrown in the league over that span. In those moments, the quarterback may have done little or nothing wrong, yet a turnover still lands in the interception column. That's bad luck.
That means every quarterback’s interception total can effectively be split into two separate buckets:
- Interceptions on turnover-worthy throws: Interceptions the quarterback earned through poor process or poor execution.
- Non-turnover-worthy-play interceptions: Interceptions generated from otherwise stable throws that were caused by factors outside the passer's control.
Using those two buckets, we can build a single measure of quarterback fortune that we’ll call net luck:
- Net luck = (turnover-worthy interceptions avoided versus league-average conversion) − (non-turnover-worthy interceptions incurred versus league average)
A positive net-luck figure means a quarterback’s interception total came in lower than expected. A negative figure means it came in higher. From there, we can also build a luck-adjusted passer rating — an estimate of what each quarterback’s traditional passer rating would have looked like if interception luck had broken league average on every throw.
Take Matthew Stafford’s 2025 season as an example. Stafford recorded 21 turnover-worthy throws, which at the league-average conversion rate would normally have produced just over 10 interceptions. But only eight did. Defenders also dropped nine additional would-be interceptions, the second-highest total in football behind only Dak Prescott’s 11.
On top of that, Stafford threw just one interception on a non-turnover-worthy play, despite his 716 pass attempts carrying an expectation closer to five and a half. Altogether, Stafford finished with a net-luck score of roughly +6.8 — meaning his interception total came in about seven picks lower than expectation once the underlying process and league-average outcomes are accounted for.
Stafford Interception Luck — 2025Interception luck · 2025
Matthew Stafford
LAR · 716 attempts · 21 turnover-worthy throws · 9 interceptions total
+6.8 Net luckFewer picks than league average on the same throws
Where the +6.8 comes from
+2.3 Bad throws + +4.5 Good throws = 6.8 TotalPicks on bad throws
21 TWP × 49.1% league rate
Expected 10.3 Actual 8 Luck on this bucket +2.3Picks on good throws
695 clean atts × 0.79% rate
Expected 5.5 Actual 1 Luck on this bucket +4.5League-average modeling expected about 15.8 picks (10.3 + 5.5). Stafford threw 9 (8 + 1) — roughly 6.8 fewer than expected on throw quality alone.
There is no such thing as a permanently lucky (or unlucky) quarterback
We pulled every quarterback with at least 250 pass attempts in consecutive seasons dating back to 2016, giving us a sample of 209 season-to-season quarterback pairs. From there, we asked a simple question: if a quarterback’s turnover-worthy throws turned into interceptions at an unusually high or low rate in one season, how likely was that to happen again the following year?
The answer: almost not at all.
The year-over-year correlation in turnover-worthy-throw interception conversion rate came out to just r = 0.12, meaning roughly 88% of a quarterback’s deviation from league average disappeared the next season. In other words, interception luck tends to regress heavily toward the mean, regardless of whether a quarterback was unusually fortunate or unusually unlucky the year before.
The most intuitive way to visualize it is to split each quarterback's season into quintiles based on the Year 1 turnover-worthy-play-to-interception conversion rate, then track what happened the following season.
Quintile Rebound · TWP→INT%
Year-1 Quintile N Avg Y1 TWP→INT% Avg Y2 TWP→INT% Movement Q1luckiest 51 31.0% 48.6% +17.6 pp Q2 33 41.9% 47.0% +5.1 pp Q3 45 48.1% 50.8% +2.8 pp Q4 38 55.3% 49.9% −5.4 pp Q5unluckiest 42 67.5% 53.1% −14.4 pp209 consecutive-season pairs, 2016–2025, 250+ attempts both years. The luckiest quintile snapped back almost exactly to the league mean (48.6%) the following season; the unluckiest landed within five points of it.
The luckiest group of quarterbacks in Year 1 — those whose turnover-worthy throws became interceptions just 31.0% of the time — jumped all the way back to 48.6% the next season, almost perfectly matching the league average. On the other end, the unluckiest quarterbacks, whose turnover-worthy throws turned into interceptions at a 67.5% clip, fell back to 53.1% the following year.
There was no meaningful carryover from one season to the next. No subgroup of quarterbacks is consistently “good” at avoiding interceptions on turnover-worthy throws. No evidence that quarterbacks who suffered unusually high interception rates were uniquely prone to repeating it.
The data is unusually clean on this point: interception luck regresses heavily toward league average.
The lucky quarterbacks from 2025
Every quarterback with at least 250 pass attempts in 2025, ranked by net luck. The QBs at the top of this list saw their interception totals come in well below what the underlying tape would normally produce. The "Rtg Δ" column tracks the same idea inside the official passer rating formula — positive numbers mean the rating was inflated by good fortune.
2025 Net Luck · Luckiest QBs
#QBTWPsINTs on TWPsnon-TWP INTsTotal INTsTWP→INT%Net Luck 1 Matthew StaffordLAR 21 8 1 9 38.1% +6.8 2 Cam WardTEN 15 4 3 7 26.7% +4.5 3 Jordan LoveGB 12 5 1 6 41.7% +3.6 4 Michael Penix Jr.ATL 9 3 0 3 33.3% +3.5 5 Jaxson DartNYG 11 3 2 5 27.3% +3.0 6 Baker MayfieldTB 20 5 6 11 25.0% +3.0 7 Dak PrescottDAL 17 6 4 10 35.3% +3.0 8 Caleb WilliamsCHI 20 9 3 12 45.0% +2.92025, 250+ attempts. League TWP→INT 49.1%. Net Luck = TWP INTs saved minus non-TWP INTs owed vs. league average.
1. Matthew Stafford, Los Angeles Rams
The single largest luck cushion of any quarterback in football in 2025, and it isn't close. Stafford generated 21 turnover-worthy throws, but only eight were intercepted. Defenders dropped nine more of them. The non-TWP side of the ledger was even cleaner: just one pick on an otherwise good throw, against an expectation of roughly five and a half.
The unsettling part is that this is the second consecutive year Stafford has finished at the very top of this list, as his 2024 season with the Rams was the luckiest season in the entire 10-year dataset.
2. Cam Ward, Tennessee Titans
Ward produced 15 turnover-worthy plays, yet only four were converted into interceptions — a 26.7% conversion rate that sits at nearly half the league average. Defenders dropped six additional would-be interceptions, while Ward was charged with just three interceptions on non-turnover-worthy throws, avoiding the kind of bad-break turnovers that often inflate rookie interception totals.
3. Jordan Love, Green Bay Packers
Love's 41.7% turnover-worthy-play-to-interception conversion rate sits below league average, but not dramatically so, and his six-interception total appears relatively normal at first glance. The real driver came on the other side of the equation. Love threw just one interception on a non-turnover-worthy play across 485 pass attempts, despite league-average rates projecting closer to four.
The unlucky quarterbacks from 2025
2025 Net Luck · Unluckiest QBs
#QBTWPsINTs on TWPsnon-TWP INTsTotal INTsTWP→INT%Net Luck 1 Geno SmithLV 18 12 5 17 66.7% −4.7 2 Brock PurdySF 12 9 4 13 75.0% −4.5 3 Justin HerbertLAC 12 5 8 13 41.7% −2.9 4 Joe FlaccoCIN/CLE 22 10 10 20 45.5% −2.8 5 Bryce YoungCAR 12 10 2 12 83.3% −2.1 6 Joe BurrowCIN 2 2 3 5 100.0% −2.0 7 Josh AllenBUF 12 9 3 12 75.0% −2.0 8 Sam DarnoldSEA 16 11 3 14 68.8% −1.8Negative Net Luck = INT total ran higher than the model expects.
1. Geno Smith, Las Vegas Raiders
The ugliest interception total in football during the 2025 season was largely driven by variance. Smith recorded 18 turnover-worthy throws — hardly an extreme figure relative to his volume — but 12 of them became interceptions, producing a 66.7% conversion rate that sat nearly 18 percentage points above the league average.
The bad luck didn’t stop there. Smith also threw five interceptions on non-turnover-worthy plays, well above the roughly 3.4 expected based on league-average rates. Altogether, his 17-interception season paints a far harsher picture than the underlying process suggests. Under league-average interception luck, Smith’s season profiles far more like a 12- or 13-interception campaign than the 17 interceptions attached to his name in the official record.
2. Brock Purdy, San Francisco 49ers
No quarterback in the 2025 dataset was hurt more by interception variance than this one. He produced just 12 turnover-worthy throws all season, yet nine turned into interceptions.
The bad breaks extended beyond his turnover-worthy throws, too, as four additional interceptions came on passes that were not deemed turnover-worthy. Nearly every form of interception variance swung against him. His official 95.0 passer rating would have climbed to 100.7 under league-average interception luck.
3. Justin Herbert, Los Angeles Chargers
Herbert represents the most deceptive case among quarterbacks hurt by interception luck. His 41.7% turnover-worthy-play interception conversion rate actually sat below league average, meaning his genuinely risky throws were not punished at an unusual rate. The damage came elsewhere. Herbert absorbed eight interceptions on non-turnover-worthy plays — the highest total in football and well beyond what his attempt volume would typically produce.
The luckiest seasons of the last decade
Zooming out to look at the last decade as a whole, here are the 10 quarterback seasons most heavily shaped by positive interception luck.
Decade · Luckiest QB-Seasons
#QBTWPsINTs on TWPsDropped INTsTotal INTsTWP→INT%Net Luck 1 Matthew StaffordLAR · 2024 227138 31.8%+7.3 2 Ben RoethlisbergerPIT · 2021 2581510 32.0%+7.2 3 Matthew StaffordLAR · 2025 21899 38.1%+6.8 4 Tom BradyTB · 2022 21101210 47.6%+6.5 5 Jared GoffDET · 2022 18597 27.8%+6.3 6 Aaron RodgersGB · 2018 7082 0.0%+6.1 7 Aaron RodgersGB · 2021 11434 36.4%+5.7 8 Caleb WilliamsCHI · 2024 15436 26.7%+5.7 9 Eli ManningNYG · 2018 2511811 44.0%+5.6 10 Aaron RodgersGB · 2020 14586 35.7%+5.62016–2025, 250+ attempts.
Matthew Stafford owns the top of this list. Twice. Back to back. The 2024 season stands as one of the clearest examples of interception variance breaking entirely in one direction. Stafford recorded 22 turnover-worthy plays — actually slightly above league average for his volume — yet only seven became interceptions while defenders dropped 13 more would-be picks. The result was an All-Pro-caliber statistical profile that would have looked different under neutral turnover variance.
What makes the stretch even more remarkable is that he essentially repeated the feat in 2025. The exact shape of the variance changed — fewer dropped interceptions, but an even wider gap between his interception total and expectation — yet the result remained the same: a stat line far cleaner than the underlying process. A third consecutive season of that level of positive interception variance would be highly unusual, and historically, the model suggests regression is much more likely than continuation.
Aaron Rodgers appears three times on the list. Rodgers' 2018 season remains the most extreme single-season outlier in the dataset. He produced just seven turnover-worthy throws all year, and not a single one became an interception. Defenders dropped eight would-be picks, allowing Rodgers to finish the season with one of the cleanest interception profiles in modern football.
The same dynamic showed up again during his 2020 MVP campaign. Rodgers' official 119.2 passer rating would have fallen to 115.3 under league-average interception luck — still one of the greatest passing seasons in NFL history, just slightly less untouchable.
Caleb Williams' rookie year ranks No. 8. Williams' +5.7 net-luck figure in 2024 always pointed toward a likely correction, and 2025 delivered it almost exactly as the model would predict. His turnover-worthy-play interception conversion rate jumped from 26.7% to 45.0%, and his interception total doubled from six to 12 despite a broadly similar decision-making profile underneath. It's a clean example of how quickly interception totals can swing once turnover luck regresses toward league average — and a warning sign for the quarterbacks sitting atop the 2025 positive-luck leaderboard.
The unluckiest seasons of the last decade
And the inverse. Every direction of variance broke against these quarterbacks, producing interception lines that meaningfully overstate how poorly they actually played.
Decade · Unluckiest QB-Seasons
#QBTWPsINTs on TWPsnon-TWP INTsTotal INTsTWP→INT%Net Luck 1 Jameis WinstonTB · 2019 3321930 63.6%−9.1 2 Baker MayfieldCLE · 2019 18101121 55.6%−8.1 3 Philip RiversSD · 2016 1813821 72.2%−7.7 4 DeShone KizerCLE · 2017 2617522 65.4%−5.7 5 Davis MillsHOU · 2022 128715 66.7%−5.4 6 Marcus MariotaTEN · 2017 1411516 78.6%−5.1 7 Trevor SiemianDEN · 2017 137714 53.8%−5.0 8 Mac JonesNE · 2021 127815 58.3%−4.8 9 Geno SmithLV · 2025 1812517 66.7%−4.8 10 Gardner MinshewLV · 2024 66410 100.0%−4.7Jameis Winston 2019 is the worst-luck QB-season of the decade by a comfortable margin.
Jameis Winston's 2019 season is the unluckiest season in the dataset by a comfortable margin. Winston generated 33 turnover-worthy throws, easily the highest single-season total across the 2016-2025 sample, and 21 of them became interceptions, producing a 63.6% conversion rate nearly 15 percentage points above league average. The bad luck extended beyond his genuinely risky throws, too, as Winston absorbed nine additional interceptions on non-turnover-worthy plays.
None of this is meant to excuse the season itself. The underlying process was still wonderfully Winston-esque. But the final interception total exaggerated just how poor it was. Winston’s infamous 30-interception campaign is remembered as one of the wildest quarterback seasons in NFL history. The model suggests the same throws would typically have produced something closer to 21 interceptions under league-average turnover variance.
Baker Mayfield's 2019 in Cleveland is the most interesting case on this list. The former No. 1 overall pick finished as the second-unluckiest quarterback in football that year: 18 turnover-worthy plays, 10 of which became interceptions, plus 11 additional interceptions on throws that were not deemed turnover-worthy. The final stat line — and the reputation that came with it — painted the season as a disappointment. The underlying tape suggests something closer to a young quarterback buried by extreme turnover variance.
Four years (and three teams) later, Mayfield now sits on the opposite side of the equation. After benefiting heavily from positive interception variance in 2025, he enters next season as one of the clearest regression candidates in football — the exact type of quarterback this model historically warns about.
The biggest year-to-year swings of the last decade
Sometimes the regression isn't a soft drift toward the mean. Sometimes the pendulum catapults in the other direction. Here are the biggest swings in TWP-to-interception conversion rate from Year 1 to Year 2.
Biggest Year-to-Year Swings
QBY1→Y2Y1 TWPsY2 TWPsY1 TWP→INT%Y2 TWP→INT%Δ (pp) Russell Wilson 2023 → 2024 9 3 33.3% 100.0% +66.7 Josh Allen 2023 → 2024 17 12 76.5% 16.7% −59.8 Josh Allen 2024 → 2025 12 12 16.7% 75.0% +58.3 Gardner Minshew 2023 → 2024 15 6 46.7% 100.0% +53.3 Kirk Cousins 2023 → 2024 5 18 20.0% 72.2% +52.2 Lamar Jackson 2023 → 2024 12 7 58.3% 14.3% −44.0 Matt Ryan 2016 → 2017 15 6 26.7% 66.7% +40.0 Kirk Cousins 2024 → 2025 18 3 72.2% 33.3% −38.9 Carson Wentz 2021 → 2022 11 12 36.4% 75.0% +38.6 Will Levis 2023 → 2024 13 13 23.1% 61.5% +38.5 Russell Wilson 2019 → 2020 8 12 37.5% 75.0% +37.5 Joe Burrow 2024 → 2025 8 2 62.5% 100.0% +37.5 Philip Rivers 2016 → 2017 18 20 72.2% 35.0% −37.2 Justin Herbert 2021 → 2022 11 11 72.7% 36.4% −36.4 Baker Mayfield 2024 → 2025 18 20 61.1% 25.0% −36.115 largest single-season TWP→INT% swings, 2016–2025, 250+ attempts both years. Allen owns two of the top three back-to-back.
Josh Allen owns two of the three largest year-over-year swings in turnover-worthy-throw-to-interception rate across the entire dataset — and they came in consecutive seasons. After posting a brutal 76.5% turnover-worthy-throw-to-interception rate in 2023, Allen swung all the way down to 16.7% in 2024, a nearly 60-point drop that helped fuel his MVP campaign. One year later, the pendulum snapped violently back in the opposite direction, climbing to 75.0% in 2025. The underlying quarterback remained largely the same across all three seasons. The interception outcomes did not.
Kirk Cousins provides perhaps the clearest illustration of how little year-to-year signal there is in the metric. He appears three separate times in the volatility sample, tracing almost a perfect-luck sandwich: a fortunate 20.0% turnover-worthy-throw-to-interception rate in 2023, an extremely unlucky 72.2% mark in 2024 and then a return to positive variance at 33.3% in 2025 while operating in a backup role. The easy explanation would point toward changing environments, injuries or role shifts. The simpler explanation is that interception variance itself is extraordinarily unstable from one season to the next.
Will Levis offers the cautionary version of the same lesson. His rookie-season 23.1% turnover-worthy-throw-to-interception rate in 2023 created the appearance of a quarterback avoiding major mistakes despite a volatile underlying profile. Then the correction arrived immediately. His turnover-worthy-throw-to-interception rate jumped by 38.5 percentage points in 2024, the interceptions followed, and he ultimately lost the starting job during the season.
A decade of interception luck
Single-season interception luck is loud. Multi-season interception luck is quieter and far more interesting. By pooling every charted throw from 2016-25 for quarterbacks with at least 1,500 pass attempts during the sample, we can start to separate the quarterbacks who merely experienced one-year variance from the ones whose interception profiles consistently ran far cleaner — or far harsher — than expectation.
The luckiest careers of the past decade
Decade · Luckiest Careers
#QBTWPsINTs on TWPsnon-TWP INTsDropped INTsCareer Net Luck 1 Aaron Rodgers10 seasons · 5,037 att 100432146 +24.2 2 Matthew Stafford10 seasons · 5,470 att 157663684 +17.1 3 Tom Brady7 seasons · 4,996 att 99482649 +13.3 4 Drew Brees5 seasons · 2,723 att 79311641 +12.7 5 Jared Goff10 seasons · 5,573 att 154703763 +11.5 6 Jacoby Brissett10 seasons · 2,245 att 5323923 +11.4 7 Dak Prescott10 seasons · 5,035 att 146584168 +11.4 8 Carson Wentz10 seasons · 3,500 att 111541853 +9.3 9 Patrick Mahomes9 seasons · 5,427 att 127603554 +9.3 10 Ben Roethlisberger6 seasons · 3,286 att 114512262 +8.1Career totals, 2016–2025, minimum 1,500 career attempts. Rodgers' +24.2 leads the dataset.
Aaron Rodgers’ net-luck figure of +24.2 is the highest in the dataset by a substantial margin. Over a decade of charted throws, the math suggests Rodgers avoided roughly 24 interceptions relative to league-average outcomes. His career turnover-worthy-throw-to-interception rate sits at 43.0%, well below the 49.1% league average, and defenders dropped 46 would-be interceptions along the way — one of the highest totals in the sample relative to his volume.
None of that changes the reality that Rodgers was one of the best quarterbacks of his era. The skill-driven side of the equation — limiting turnover-worthy throws in the first place — still grades out at an elite level. But this model suggests that part of the “never throws interceptions” reputation was also driven by unusually favorable turnover variance over a long period.
Patrick Mahomes’ appearance inside the top 10 may be the most surprising name in the sample. His reputation for avoiding catastrophic mistakes is rooted in real process, as his turnover-worthy-throw rate has consistently remained strong relative to league norms. But when those risky throws did occur, the outcomes also tilted in his favor. Across nine seasons, Mahomes benefited from 54 dropped interceptions while absorbing just 35 interceptions on non-turnover-worthy throws. In other words, he has consistently landed on the positive side of the variance equation. That doesn’t diminish the level of quarterback play; it simply suggests the interception column has likely run cleaner than expectation for much of his career, something worth remembering if that total begins to climb in future seasons.
The unluckiest careers of the past decade
Decade · Unluckiest Careers
#QBTWPsINTs on TWPsnon-TWP INTsDropped INTsCareer Net Luck 1 Jameis Winston10 seasons · 2,712 att 129653356 −14.2 2 Jimmy Garoppolo9 seasons · 2,037 att 64362222 −11.0 3 Baker Mayfield8 seasons · 4,104 att 130683653 −8.7 4 Ryan Fitzpatrick6 seasons · 1,587 att 67361725 −8.1 5 Brock Purdy4 seasons · 1,582 att 43281310 −7.7 6 Sam Darnold8 seasons · 2,964 att 108671636 −7.4 7 Mac Jones5 seasons · 1,901 att 62341818 −7.0 8 Joe Burrow6 seasons · 3,057 att 51302525 −6.2 9 Joe Flacco10 seasons · 3,143 att 88432934 −4.6 10 Kirk Cousins10 seasons · 5,048 att 119624055 −4.6Career totals, 2016–2025, minimum 1,500 career attempts.
Jameis Winston’s career net-luck figure of -14.2 ranks as the worst in the dataset, driven largely — though not entirely — by his infamous 2019 season. Winston also owns the highest non-turnover-worthy-play interception rate in the sample at 1.28%, well above the 0.79% league average. Even when he delivered otherwise stable throws, an unusually high number still found their way into defenders’ hands. The chaos was real. The interception totals were even harsher than the underlying play deserved.
Brock Purdy’s placement near the top of the unlucky list is perhaps the most consequential finding in the entire study. Despite only four seasons in the sample, his 65.1% career turnover-worthy-throw-to-interception rate is the highest among quarterbacks with at least 1,500 pass attempts — more than 16 percentage points above league average. Normally, over a multi-year sample that large, the variance begins to stabilize. It hasn’t for Purdy. The result is a quarterback whose interception totals have consistently run worse than the process suggests. If you viewed Purdy’s recent seasons strictly through the lens of the box score, this model would argue that the actual quarterback play has been meaningfully better than the interception totals indicate.
The career TWP→INT% extremes
Isolating the conversion rate alone — the share of a quarterback’s turnover-worthy throws that actually became interceptions — paints an even cleaner picture of which quarterbacks have run hottest and coldest on interception luck over the past decade.
Career · Lowest TWP→INT% (Luckiest)
#QBCareer TWPsTWP→INT% 1 Drew Brees 79 39.2% 2 Dak Prescott 146 39.7% 3 Mitch Trubisky 79 40.5% 4 Matthew Stafford 157 42.0% 5 Aaron Rodgers 100 43.0%League career average TWP→INT% is 49.1%. Minimum 1,500 career attempts, 2016–2025.
Career · Highest TWP→INT% (Unluckiest)
#QBCareer TWPsTWP→INT% 1 Brock Purdy 43 65.1% 2 Sam Darnold 108 62.0% 3 Marcus Mariota 67 61.2% 4 Joe Burrow 51 58.8% 5 Jimmy Garoppolo 64 56.3%Same denominator. Purdy's 65.1% is the highest in the dataset among qualifying QBs.
The "got away with it" leaderboard — most dropped interceptions
Career · Most Dropped Interceptions
#QBCareer TWPsTotal Dropped INTsDrop % on TWPs 1 Matthew Stafford 1578442.0% 2 Dak Prescott 1466835.6% 3 Jared Goff 1546333.1% 4 Ben Roethlisberger 1146241.2% 5 Josh Allen 1405834.3% 6 Jameis Winston 1295631.0% 7 Kirk Cousins 1195530.3% 8 Patrick Mahomes 1275435.4% 9 Carson Wentz 1115331.5% 9 Baker Mayfield 1305330.0%Most turnover-worthy throws that escaped the box score, 2016–2025.
Matthew Stafford has seen 84 turnover-worthy throws over the past decade fall through the hands of a hapless defensive back. Ben Roethlisberger’s rate was also extreme relative to volume.
The "WR drops cost me" leaderboard
Career · Most WR-Drop Interceptions
#QBCareer AttWR-Drop INTs 1 Kirk Cousins 5,048 10 1 Patrick Mahomes 5,427 10 1 Dak Prescott 5,035 10 4 Matt Ryan 4,099 9 5 Ryan Fitzpatrick 1,587 7 5 Andy Dalton 3,155 7 5 Derek Carr 4,667 7 5 Josh Allen 4,622 7 5 Trevor Lawrence 2,710 7 10 Joe Flacco 3,143 6Picks caused by receiver drops on otherwise-good throws, 2016–2025. Fitzpatrick's rate per attempt is the highest in the dataset.
Wide receiver-drop interceptions are the purest form of bad luck in this entire study — accurate or otherwise defensible throws that hit a receiver’s hands before ending up in a defender’s. The quarterback executes the play well enough to avoid a turnover, yet the interception still lands beside his name in the box score.
Kirk Cousins, Patrick Mahomes and Dak Prescott have each absorbed 10 of these interceptions over the past decade, the highest totals in the dataset. Ryan Fitzpatrick appears lower on the raw list because of volume, but his rate is the most extreme in the sample: 10 receiver-drop interceptions on just 1,587 pass attempts, the highest per-attempt mark in the dataset.
There is no identifiable quarterback skill that meaningfully controls this outcome. Sometimes the ball simply bounces the wrong way.
Final thoughts
The interception remains one of the cleanest-looking stats in football. It lives in every box score, shapes every quarterback debate and quietly influences everything from MVP voting to contract negotiations. But across a decade of charted data, the evidence is unusually clear: far less of that number belongs entirely to the quarterback than the sport tends to assume.
Roughly 88% of a quarterback’s deviation from league-average turnover-worthy-throw-to-interception rate disappears the following season. Non-turnover-worthy-play interceptions regress almost completely. The luckiest quarterbacks in one year almost always drift back toward league average the next. So do the unluckiest ones. There is little evidence that quarterbacks possess a repeatable skill for consistently avoiding interceptions once the ball has already been put in harm’s way.
That doesn’t make quarterback evaluation meaningless. In fact, it sharpens it. The most predictive part of interception analysis is not the interception itself, but how often the quarterback generates turnover-worthy throws in the first place. That’s the stable signal. That’s the part most closely tied to process, decision-making and quarterback play. It’s also the part that is far less visible in public conversation.
The Edelman catch belongs in a turnover-worthy-throw ledger that never appears in a box score. So do Matthew Stafford’s dropped interceptions in 2025. So do Geno Smith’s “didn’t earn it” interceptions. Those hidden plays — the turnovers that almost happened and the turnovers that never should have happened at all — shape quarterback narratives just as much as the interceptions we remember.
The difference is that only one side of that equation gets counted.